MapGenius
A Geo-Visualization Tool for Mapping Movement and Timing Data.
The Challenge: Data Without Context is Just Noise
Businesses in logistics, security, and retail collect vast amounts of location and time-based data. In its raw form, this data is difficult to interpret. Uncovering patterns, identifying inefficiencies, and making strategic decisions requires a powerful and intuitive visualization tool.
Our Solution: Turning Geo-Data into Strategic Insight
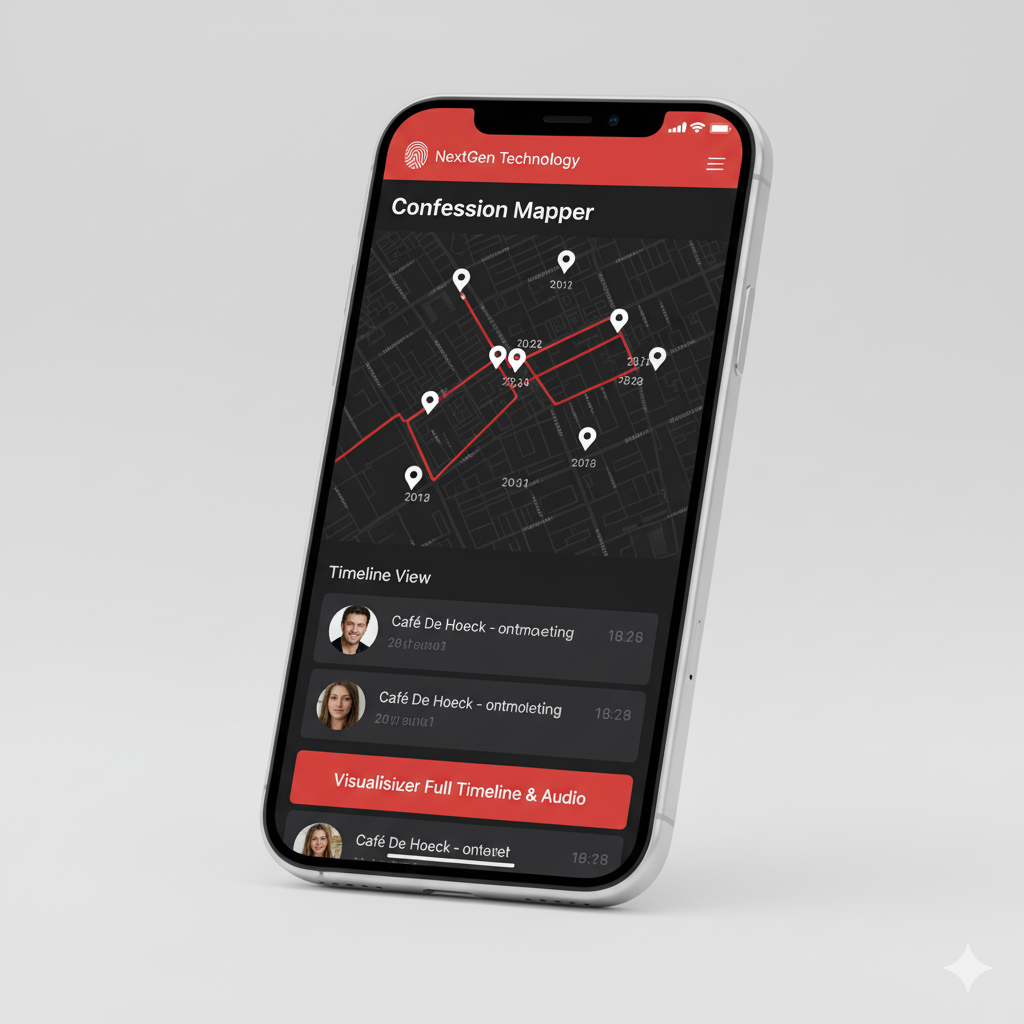
MapGenius is a sophisticated yet easy-to-use platform that transforms your raw data into rich, interactive maps. Visualize delivery routes, track asset movements, analyze foot traffic patterns, and uncover hidden correlations in your data to optimize operations and gain a competitive edge.
Key Features
Interactive Map Layers
Overlay multiple datasets—such as vehicle locations, sales data, and time stamps—on a single, dynamic map.
Heatmap & Density Analysis
Instantly identify hotspots, areas of high activity, and customer concentration with powerful heatmap visualizations.
Customizable Reporting
Generate and export detailed reports and visual summaries to share key insights with your team and stakeholders.
Unlock the Power of Your Location Data
Join our early access program to be among the first to experience MapGenius.
Request Early Access